
Product fault tracking and failure rate software for Shopify.
Know which product is failing, how it fails, and who should pay for it.
ReturnMate turns every technician diagnosis into structured quality data. Faults are recorded against a configurable three-level taxonomy, linked to SKU, serial, batch and supplier, measured as a failure rate against thresholds you set, and exported as evidence for supplier warranty claims and chargebacks.
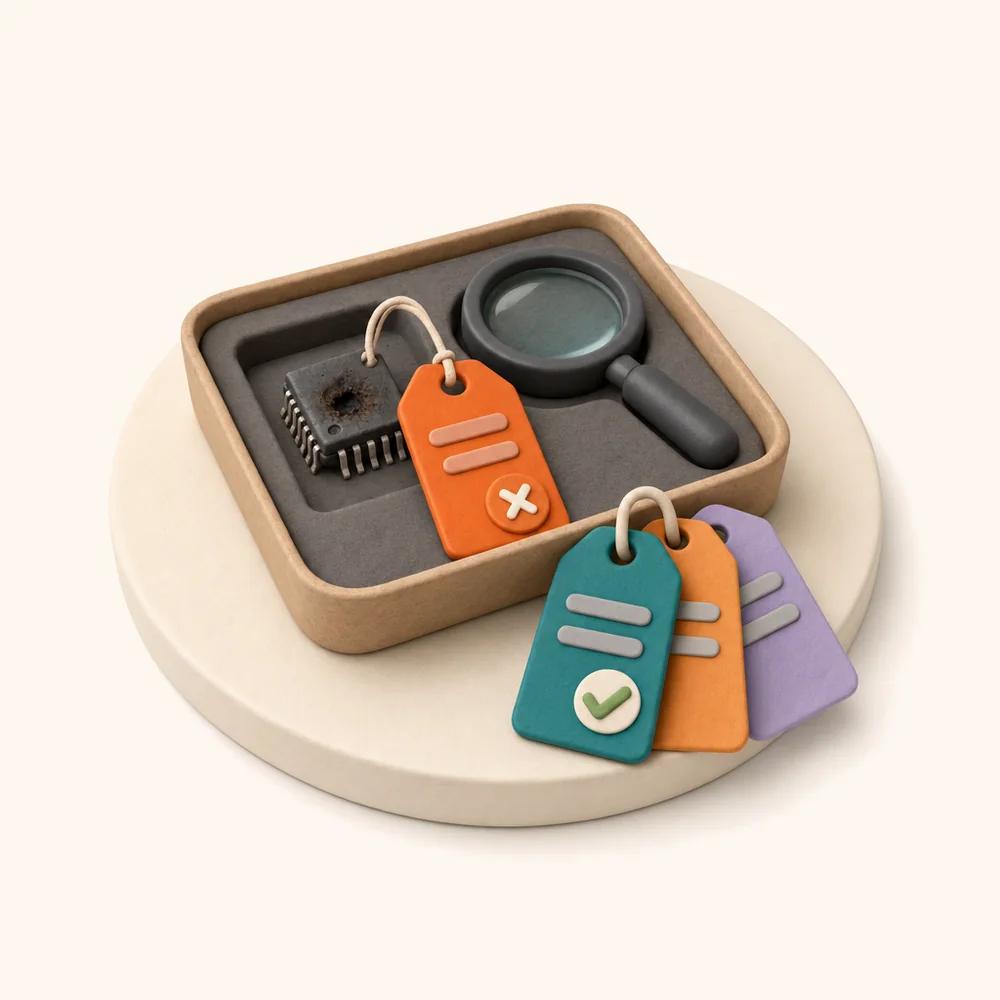

Four places a fault gets recorded — and only one of them counts as confirmed.
A customer saying "it stopped working" and a technician finding a shorted MOSFET are not the same data point. ReturnMate keeps them separate, so your failure rates are built on confirmed diagnoses rather than complaint volume.
Customer claim
Structured fault selection and description at submission, with photo evidence attached.
REPORTEDWarehouse receipt
Condition on arrival, transit damage and packaging state recorded at scan-in.
OBSERVEDTechnician diagnosis
Three-level classification, severity and findings recorded at the bench, in the app or on desktop.
CONFIRMEDThird-party repair
Findings returned from an external workshop, recorded against the same job.
CONFIRMED- Customer-reported fault kept separate from technician-confirmed fault, permanently
- Reported-versus-confirmed gap is itself reportable — where customers mis-diagnose most
- Serial captured and verified, so the fault attaches to a specific unit
- Every diagnosis timestamped and attributed to the technician who made it
A fault taxonomy you configure, not a free-text box.
Three levels — product family, fault category, fault subcategory — defined once for your catalogue. Technicians pick from a list, which means the data is queryable the day after you set it up rather than after a cleaning exercise.
- Product families mapped to your Shopify collections, tags or product types
- Fault categories and subcategories defined per family — an appliance list differs from a tool list
- Technicians select, they don't type, so two people describe the same fault identically
- Add subcategories as new failure modes appear, without breaking historical reporting
- Every level is filterable and exportable independently
- Works the same for electronics, appliances, tools, machinery, mobility and battery products
This is the structure that makes everything below it possible. Free-text fault reasons can't be counted, thresholded or argued with a supplier.
A scuffed housing shouldn't rank with a thermal event.
Severity is recorded alongside classification, so a rising fault count means something. Ten cosmetic marks and ten safety-relevant failures produce very different decisions — and very different supplier conversations.
- Severity captured at diagnosis, by the technician who saw the unit
- Failure-rate calculations can include or exclude cosmetic faults
- Safety-relevant faults raise an immediate alert rather than waiting for a threshold
- Severity mix per SKU shows whether a product is annoying or dangerous
Set the threshold once. Get told when it breaks.
Failure rate is confirmed faults measured against units actually sold in the same window — not against total returns, which flatters a bad product in a bad quarter. You set the acceptable rate per SKU; ReturnMate watches it.
- Failure rate calculated against units sold, from your Shopify order data
- Repeat-failure thresholds set per SKU, not one global number
- Choose whether cosmetic faults count toward the rate
- Alerts by email and in-app when a product crosses its limit
- Rolling windows — 30, 90 or 365 days — so a seasonal spike doesn't hide
- Repeat-offender detection when the same serial returns more than once
More on the method in our guide to product failure rate tracking.
From fourteen faults to one supplier batch.
A failure rate tells you there's a problem. Attribution tells you whose problem it is. Because every fault carries a serial, and every serial carries a batch and a supplier, the narrowing happens automatically.
BMS failure on PW-1200, trailing 90 days.
No duplicates — fourteen separate units.
Eleven of fourteen from one supplier batch.
Labour, parts and freight attributable to that batch.
- Fault linked to SKU, serial, batch and supplier at the point of diagnosis
- Batch-level clustering surfaces manufacturing issues a SKU average hides
- Supplier defect rates comparable across your whole catalogue
- Supplier-responsible cost tracked across labour, parts and freight — not just unit counts
- Defective units grouped for return-to-vendor processing
- Credits and recovery tracked back against the original warranty cost
Direction matters more than the number.
A 2% failure rate that has doubled in two months is a bigger problem than a stable 4%. Month-over-month movement per SKU and per fault subcategory is on the same screen as the current rate.
BMS FAILURE
CONTROL BOARD
CHUCK WEAR
FRAME DAMAGE
CONTROLLER FAULT
- Fault category and subcategory trends over any rolling window
- Month-over-month movement in percentage points, not vague arrows
- Average repair cost by product and by fault type alongside the rate
- Labour and parts cost trends, so a cheap fault that got expensive shows up
- Supplier defect rates compared across suppliers over time
- Return rate by SKU and by reason, reconciled against fault data
Export the argument, not the anecdote.
Supplier conversations are won with fourteen technician-confirmed diagnoses on one batch, each with a serial, a photo set, a labour figure and a date. That pack assembles from the data you already captured.
- CSV export of any filtered fault list, at any time
- Exportable reporting formatted for manufacturers and suppliers
- Every diagnosis carries the technician, timestamp and serial — audit-ready
- Photo evidence travels with the claim
- Credits and recovery recorded against the original warranty cost
- Webhook events push fault data to your BI or ERP in real time
Recovery workflows are covered in more depth on the Shopify warranty app page.
Four decisions this data actually makes.
Fault tracking isn't a dashboard exercise. It exists so that four recurring questions stop being answered by whoever remembers the most.
Repair or replace this SKU?
When average cost-to-repair approaches replacement cost, replacing is cheaper — and now you can see the crossover instead of guessing it.
AVG REPAIR COST VS UNIT COST, PER SKUShould we keep stocking it?
A product with a 6% failure rate and $268 average repair cost may be losing money on every unit sold. Warranty cost per unit sold makes that visible.
WARRANTY COST PER UNIT SOLDWhat do we claim from the supplier?
Batch clustering and attributed cost give you a number and the evidence behind it, rather than a request for goodwill.
SUPPLIER-RESPONSIBLE COST BY BATCHIs the new revision actually better?
Compare failure rate by batch before and after a design or supplier change, on the same fault subcategory.
FAILURE RATE BY BATCH, OVER TIMEFault tracking questions.
What is product fault tracking?
Product fault tracking is the practice of recording why products fail in a structured, countable way — rather than as free-text notes — and measuring those failures as a rate against units sold, so quality problems, manufacturing defects and supplier issues can be identified early and evidenced. In ReturnMate, every warranty and repair job records a three-level fault classification and a severity level against a specific serial number, SKU, batch and supplier. That data becomes failure rates, threshold alerts, trend reporting and exportable evidence for supplier claims.
How is failure rate calculated?
Confirmed faults divided by units sold in the same rolling window, using your Shopify order data — not faults divided by total returns, which understates a problem in a quarter with high return volume. You choose the window (30, 90 or 365 days), whether cosmetic faults count, and the acceptable threshold per SKU.
What's the difference between a customer-reported and a technician-confirmed fault?
A customer-reported fault is what the customer selected and described when they submitted the claim. A technician-confirmed fault is what was actually found when the unit was opened. ReturnMate stores both, permanently and separately — failure rates are built on confirmed diagnoses, and the gap between the two is itself reportable.
Can I trace faults back to a supplier batch?
Yes. Faults attach to a serial number, and serials carry batch and supplier information — so a cluster of failures narrows from "this SKU has a problem" to "eleven of these fourteen units came from batch PW-2409". Supplier-responsible cost is then tracked across labour, parts and freight, and defective units can be grouped for return-to-vendor processing.
Do I get alerted when a product starts failing?
Yes. Repeat-failure thresholds are set per SKU, and crossing one raises an alert by email and in-app to whoever you nominate. Safety-relevant faults raise an immediate alert without waiting for a threshold, and repeat-offender detection flags a serial that comes back more than once.
Can I export fault data for a supplier claim?
Yes. Any filtered fault list exports as CSV, and a supplier claim pack assembles the serial list, technician findings and timestamps, photo evidence, parts consumed at cost, freight and the failure rate against threshold. Webhook events can also push fault data to your BI or ERP in real time.
Does this work for products that aren't electronics?
Yes. The taxonomy is configured per product family, so an appliance list, a power tool list and a battery list can each have their own fault categories and subcategories. It's built for merchants selling electronics, appliances, tools, machinery, mobility products and battery-powered goods — anything where a return is diagnosed rather than just restocked.
How much does it cost?
Fault tracking is part of the ReturnMate platform, not a separate product. ReturnMate has a Free plan at $0/month including 5 RMAs. Starter is $49/month for up to 50 RMAs, with Growth, Ops, Scale and Enterprise plans available for larger operations. See full pricing →
Related capabilities.
Where fault data gets created.
Coverage decisions, technician diagnostics, parts and labour, paid repair quotes and supplier recovery — the workflow that produces every data point on this page.
Read more →§ GUIDEProduct failure rate tracking, explained.
How to choose a threshold, what window to measure over, and how to build a supplier conversation that gets a credit rather than a shrug.
Read the guide →§ GUIDEShopify warranty management: the practical guide.
The full process the fault code sits inside: intake, coverage check, diagnosis, resolution and the supplier claim, with a printable checklist.
Read the guide →Find the product that's quietly costing you money.
See fault tracking running on your own catalogue. Billed through Shopify, cancel from inside Shopify.